.jpg)


Superstream Introduces: Deep Kafka Monitoring
Apache Kafka is the heartbeat of modern data infrastructure — powering real-time analytics, event-driven applications, and data pipelines across every industry. But for all its power, Kafka often feels like a black box: you know it’s running, but diagnosing lags, throughput issues, or resource imbalances takes hours of digging across metrics, topics, and consumers.
Today, we’re excited to introduce Deep Kafka Monitoring, a new Superstream capability that gives teams instant, visual, and intelligent insight into every Kafka cluster, topic, and client. With Deep Monitoring, you can now understand exactly how your Kafka ecosystem behaves — in real time, with precision, and without extra configuration.
Why Kafka Monitoring Matters More Than Ever
Kafka sits at the center of mission-critical data flows — from trading systems to customer analytics to AI pipelines. But monitoring Kafka performance is notoriously difficult:
- Metrics are fragmented across clusters and client libraries.
- Consumer lag and throughput anomalies go unnoticed until they break production.
- Diagnosing performance requires combining metrics from multiple dashboards, often without historical context.
Superstream’s new Deep Kafka Monitoring solves these challenges by unifying your metrics into one intelligent layer — automatically mapping producers, consumers, topics, and clusters into a single view that tells the full story of your streaming infrastructure.
A Unified View of Kafka Health
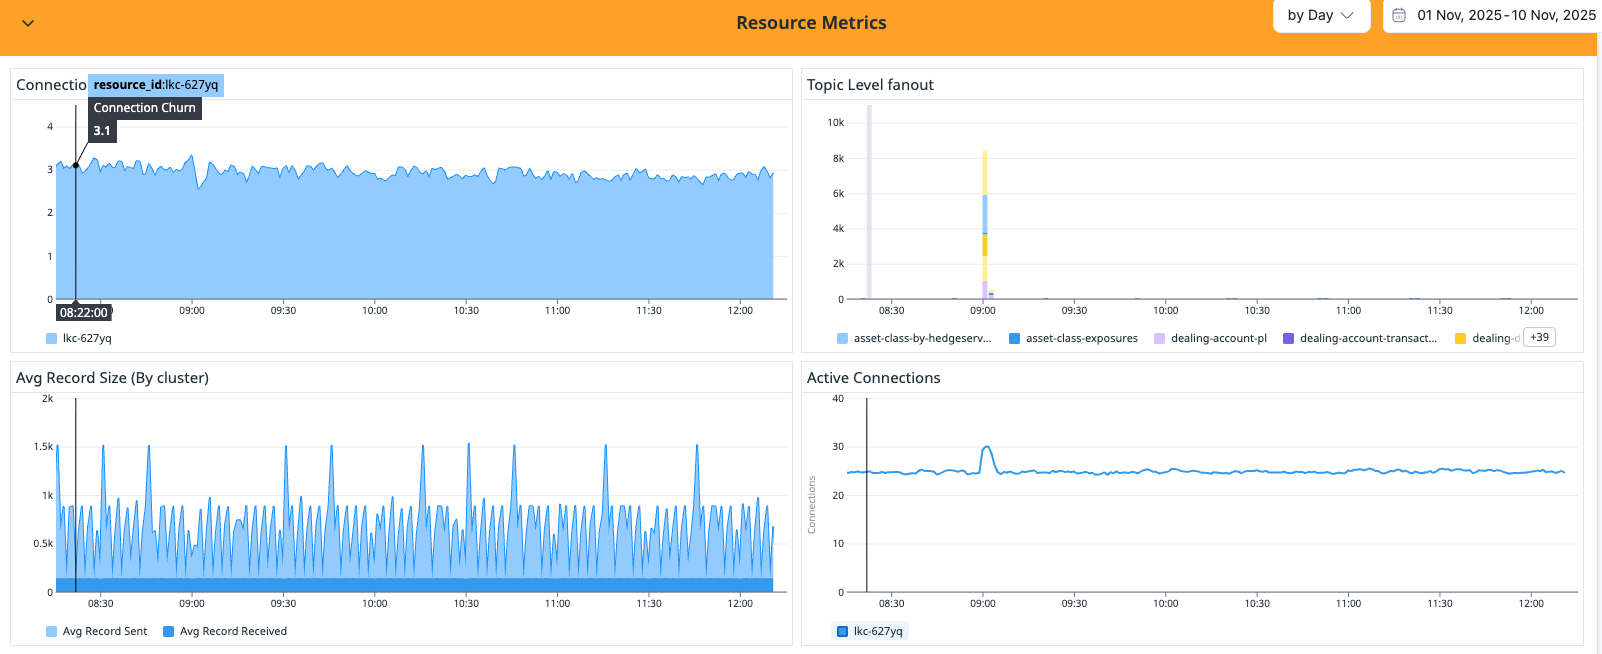
The Resource Metrics dashboard (see screenshot above) brings together the key signals that matter most:
- Connection Churn and Active Connections:
You can now visualize connection activity across clusters in real time. In the example dashboard, connection churn for clusterlkc-627yqremains stable at around 3.1 — indicating a healthy, consistent connection pool. The Active Connections graph below tracks live clients per cluster, showing minor fluctuations around 25 connections with clear visibility into anomalies. - Topic-Level Fanout:
Deep Monitoring automatically correlates which topics are being broadcast across which consumer groups. You can instantly see which data streams have high fanout — for instance,asset-class-exposuresanddealing-account-pl— helping identify performance hotspots or over-subscribed consumers. - Average Record Size (by cluster):
Spikes in record size are an early indicator of batching inefficiencies or schema evolution. The dashboard clearly shows rhythmic spikes every few minutes, revealing predictable load cycles.
These insights provide engineering and DevOps teams with actionable signals — not just raw metrics — helping reduce MTTR from hours to seconds.

Bytes In, Bytes Out: Understanding Data Flow Through Kafka
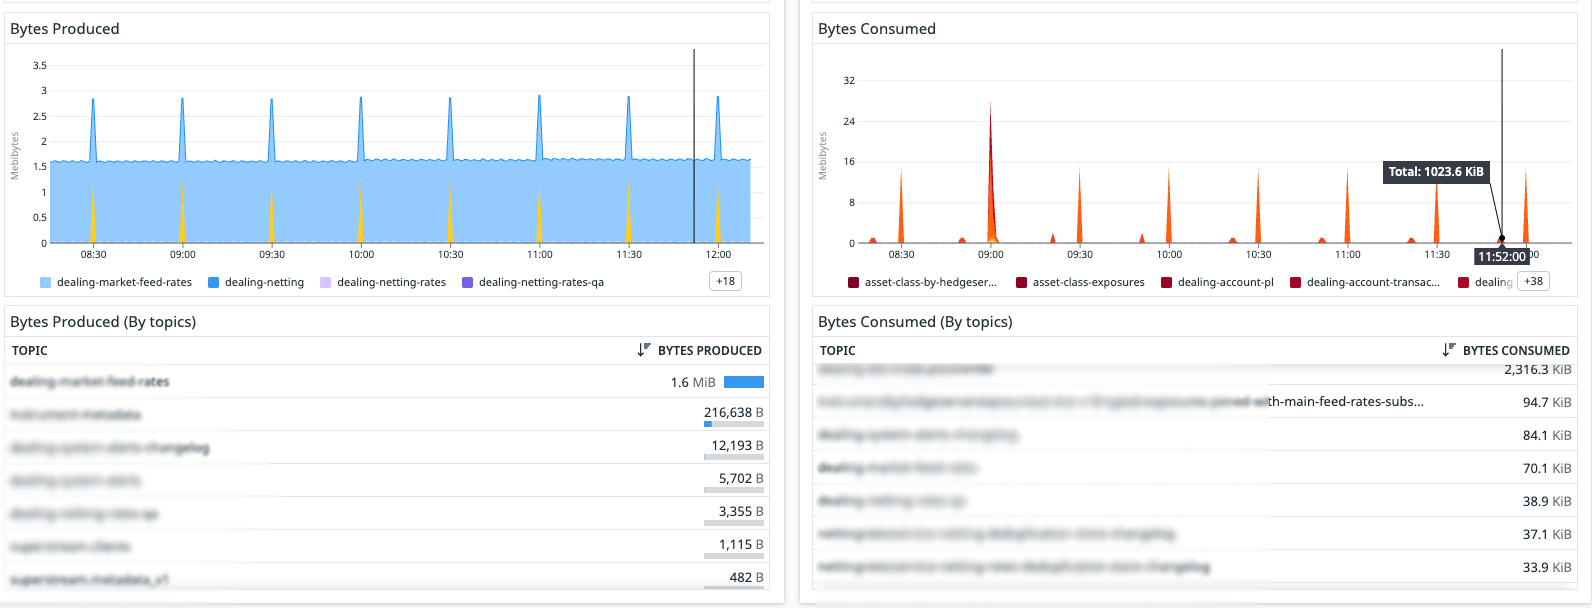
One of the most powerful views in Deep Kafka Monitoring is the Bytes Produced vs. Bytes Consumed visualization. It connects throughput across producers and consumers in a single frame.
On the Bytes Produced side, this tells you your upstream producers are stable and consistently publishing data.
On the Bytes Consumed side, the alignment (or misalignment) of these peaks instantly shows whether consumers are keeping pace or falling behind.
In this case, the Consumer Lag panel from the Overview dashboard shows a repeating pattern of lag spikes up to ~50 records, which quickly resolve. This periodic lag is typical of batch consumers that poll at set intervals — and thanks to Deep Monitoring, that behavior is now clearly visible and quantifiable.
Intelligent Ratios and Lag Insights
Superstream’s monitoring layer doesn’t stop at visualization — it introduces derived intelligence metrics that help you interpret Kafka health automatically.
- Consumer-to-Producer Ratio:
This single number (0.53 in the example) summarizes how much consumer activity keeps up with producer throughput. A healthy ratio near 1 means your consumers are processing events as fast as they’re produced. Anything below 0.5 signals backlog buildup or under-provisioned consumers. - Change in Active Connections:
Deep Monitoring automatically detects and flags percentage changes in active connections. Even minor dips — such as the -1.4% seen here — can indicate broker restarts, client disconnects, or rolling deployments. You get the context instantly. - Total Throughput per Resource:
The throughput timeline reveals exact bandwidth utilization in megabytes, so you can pinpoint when your data flow peaks. This helps right-size brokers and optimize partitioning strategies without guessing.
Designed for Scale, Built for Clarity
Deep Kafka Monitoring is not just a visualization layer — it’s a stream intelligence engine built on top of Superstream’s real-time analytics platform. It collects metrics directly from Kafka clusters, normalizes them across environments, and applies anomaly detection and correlation logic so you see patterns that matter.
You can deploy it in minutes, without modifying your Kafka clients. Once connected, Superstream automatically discovers clusters, topics, and client relationships — so your dashboard comes alive instantly with insights like:
- Which topics generate the most load.
- Which consumers cause lag under certain traffic patterns.
- How connection churn correlates with throughput or latency changes.
Available Now
Deep Kafka Monitoring is available today for all Superstream customers. To get started, connect your Kafka clusters in the Superstream console and explore your first insights within minutes.
Your data doesn’t have to be a mystery. With Superstream, it’s transparent, explainable, and — finally — under your control.

.webp)


